Understanding Candlestick Patterns for Binary Options
Candlestick patterns serve as a critical asset for traders, especially those who engage in binary options trading. They are instrumental in decoding market sentiment and anticipating potential fluctuations in prices. By meticulously analyzing these patterns, traders can arrive at more calculated decisions concerning their binary options entries, thus minimizing risks and enhancing the probability of favorable outcomes.
What are Candlestick Patterns?
Candlestick patterns are visual tools used across financial markets to depict price trends. Each candlestick encapsulates a wealth of price information over a designated time frame. By representing the opening, closing, high, and low prices, each candlestick presents a snapshot of price action during that timeframe. A multitude of candlesticks displayed in sequence offers a more comprehensive picture of the market’s overall direction and momentum.
Key Features of Candlestick Patterns
Each candlestick has a body, which is the area between the opening and closing prices, and shadows or wicks that stretch from the highs and lows of the period. The color of the body typically denotes whether the closing price was higher or lower than the opening price, highlighting bullish or bearish periods respectively.
Why Use Candlestick Patterns in Binary Options?
Understanding and interpreting candlestick patterns is essential for traders entering the binary options realm. These patterns provide insights into market psychology, exemplifying whether buyers (or bulls) or sellers (or bears) dominate. When candlesticks are used effectively, they can act as early signals of potential market reversals or continuations. This knowledge enables traders to make better-timed decisions about when to enter or exit a trade, aiming for optimal trade execution and advantageous outcomes.
Key Candlestick Patterns for Binary Options Trading
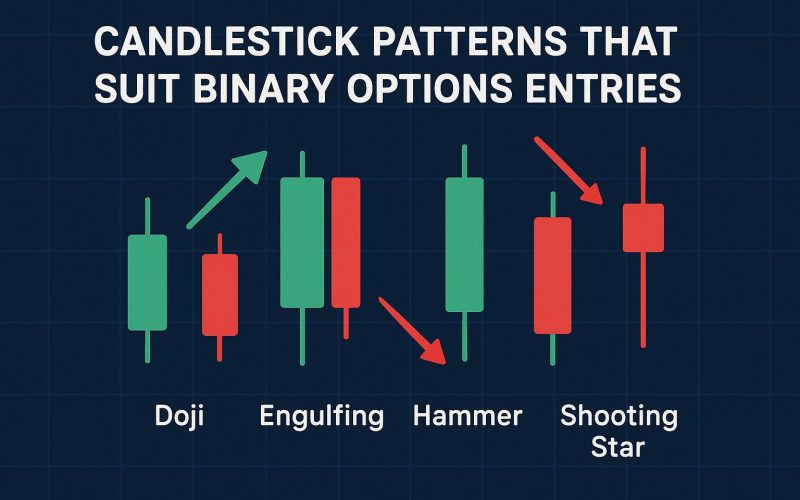
In the complex landscape of candlestick patterns, certain forms are particularly favorable for binary options trading due to their ability to highlight significant market reversals or trends. Below, we delve into some of the standard patterns traders frequently use to inform their binary options strategies.
Doji
A Doji pattern is characterized by an almost identical opening and closing price, resulting in a candlestick resembling a cross or plus sign. The Doji signifies a state of indecision in the market, often preceding a potential reversal. However, it is prudent for traders to seek confirmation from subsequent price actions before making a decisive entry based on this pattern.
The Doji does not indicate a specific direction but merely signals that the market could potentially swing in either direction—hence the importance of corroboration through additional analysis or patterns.
Hammer and Hanging Man
The concepts of Hammer and Hanging Man pertain to singular candlestick patterns that frequently herald reversals. A Hammer is indicative of a bullish reversal at the conclusion of a downtrend, characterized by a diminutive body and a lengthy lower shadow. On the contrary, a Hanging Man emerges during uptrends, suggesting a possible bearish reversal.
Both patterns exhibit similar appearances but convey different implications depending on their positions within the market trend. Recognizing these patterns can be a pivotal aspect of a trader’s strategy in detecting turning points.
Engulfing Patterns
Both Bullish Engulfing and Bearish Engulfing patterns consist of two candles and stand as strong indicators of potential trend changes. In these formations, the second candle entirely engulfs the body of the previous candle. The Bullish Engulfing pattern suggests reversing to an upward trend, while the Bearish Engulfing indicates a potential downturn.
Engulfing patterns often signify a powerful shift in market control from bears to bulls or vice versa, thus being critical signals of impending trend reversals.
The Morning Star and Evening Star
The Morning Star and Evening Star depict three-candle formations signifying reversals. A Morning Star arises amidst a downtrend, hinting at an upward movement reversal. Conversely, the Evening Star foreshadows a reversal to the downside amid an uptrend. These complex patterns offer significant clarity for traders intent on identifying potential entry and exit points with clear signals.
Implementing Candlestick Patterns in Trading Strategies
Integrating candlestick patterns into binary options trading strategies requires aligning them with other technical analytical frameworks to optimize reliability and effectiveness. Indicators such as moving averages, Relative Strength Index (RSI), or stochastic oscillators can amplify signal validity when used alongside candlestick patterns. Simultaneously, awareness of broader market contexts, including geopolitical and economic conditions, enriches the analysis spectrum.
Risk management also plays an indispensable role when employing any trading strategy. Establishing stop-loss orders and position sizing remains crucial to preserving gains and mitigating potential losses.
By thoroughly understanding and engaging with these candlestick patterns, traders in the binary options domain can significantly bolster their chances of conducting successful trades. For more expansive and nuanced strategies, delving into detailed resources and engaging with analyses from seasoned financial experts or platforms might offer profound insights. The journey of mastering candlestick patterns can be intricate, yet the knowledge gained can massively impact a trader’s capability to navigate the unpredictable realm of financial markets with acumen and precision.
This article was last updated on: July 10, 2026