Understanding Resistance Zones
Resistance zones play a pivotal role in the realm of technical analysis, serving as critical markers for traders engaged in binary options and other trading environments. Functioning as barriers, these zones effectively illustrate levels where a rising price may falter temporarily, primarily due to an increased concentration of selling pressure or a general lack of buying interest. Accurately identifying these zones can significantly aid in making more informed trading decisions, potentially leading to higher profitability for traders.
Identifying Resistance Zones
The process of identifying resistance zones involves a thorough examination of historical price data to pinpoint specific levels at which a particular asset’s price has consistently failed to break through on several occasions. These efforts often culminate in the drawing of horizontal lines or bands across a chart to visually demarcate where prices could potentially struggle to ascend beyond, serving as a reliable guide for traders in anticipating price movements.
Use of Candlestick Patterns
One common approach to spotting resistance zones involves the meticulous analysis of candlestick patterns. Traders frequently look for specific formations like double tops or evening stars, known to be strong indicators of resistance. These patterns typically manifest at the tail end of an uptrend and may signal the potential onset of a reversal. A deep understanding and recognition of these patterns can enhance the timing of trades in binary options, offering a strategic advantage.
Technical Indicators
In addition to candlestick patterns, many traders incorporate a range of technical indicators to bolster their resistance zone analysis. For instance, tools such as the Relative Strength Index (RSI) or Bollinger Bands can provide complementary insights. A high RSI value, especially above 70, may signify that a security is currently overbought, mirroring the characteristics of a resistance zone, thereby suggesting the possibility of a forthcoming price pullback.
Application in Binary Options Trading
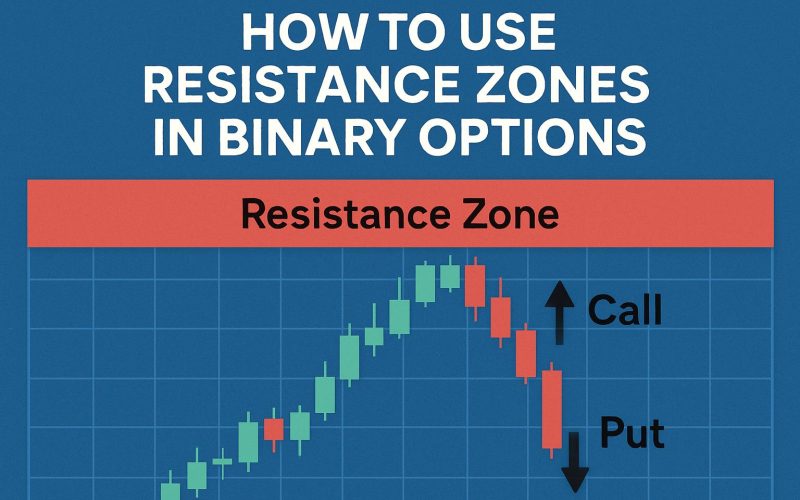
In the niche market of binary options trading, the ability to accurately identify resistance zones is essential for predicting potential price movements with greater precision. Suppose a trader anticipates that an asset’s price is approaching a resistance zone; in such cases, they might opt for a put option, predicting a potential downturn in price. Conversely, a successful breakout above a resistance zone could be perceived as an opportunity to place a call option, anticipating upward momentum.
Risk Management
Effective risk management strategies should invariably accompany the analysis of resistance zones. Given the inherent unpredictability of financial markets, traders are advised to implement measures such as setting stop-loss orders or opting to trade with only a portion of their total capital. These precautions serve to mitigate potential losses, ensuring a more balanced and secure approach to trading decisions.
To further enhance your understanding of technical analysis strategies and their applications, consider exploring resources from reputable trading education platforms or subscribing to financial publications that provide detailed insights and practical techniques designed to refine and elevate your trading skills.
This article was last updated on: May 22, 2026